This page describes the steps to create a cross-tab report by
using the Pivot Grid control. This control is intended to embed a pivot table into a report, giving
you the capability to automatically calculate summaries and grand totals across
an unlimited number of table rows and columns.
This example will create the report named "Activities Pivot on Type and Month" You can edit this report so see the finished product.
Follow these steps:
Create a new report using the "NEW" icon on the top ribbon selecting the Activity table.
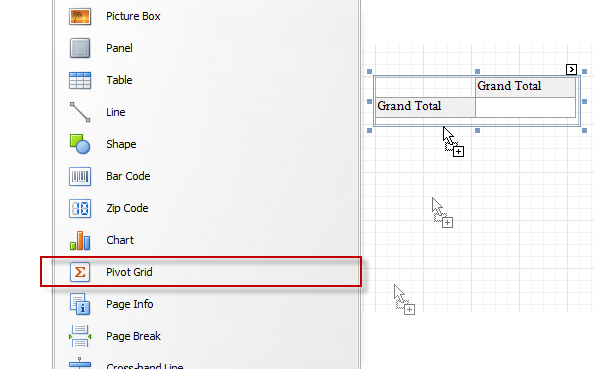
Drop the Pivot Grid
control from the Toolbox tab onto the Detail
band.
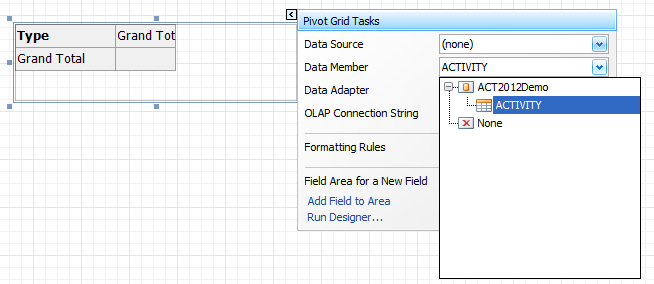
Click the Smart Tags for the PivotGrid, and in its actions list's DataMember drop-down menu,
click the Activity table.
Note
If the PivotGrid uses the same table as the report itself. Which ever table you selected creating the report, select the same table in the Data Member dropdown
This is necessary, because if the report uses the same data source, this
causes an invalid output: the report's Detail band, along with the pivot grid it
contains, is printed as many times as there are rows in this data source.
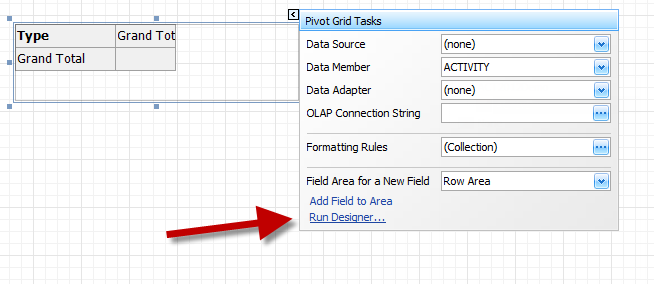
Define the Pivot Grid's Content 4. Again, via the pivot grid's smart tag, invoke its actions list, and click the
Run Designer... link.
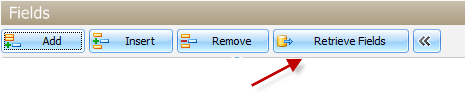
In the dialog, click the Retrieve Fields button.
Switch to the Layout section in the navigation bar on the left.
To define the pivot grid's layout, drag & drop the required fields onto
the appropriate areas. For example:
- the Month field to the Row
Fields area; ( This is the field which will expand to the right )
- the Type field to the Column
Fields area; ( This is the field which will expand downward )
- and the Quantity and ExtendedPrice fields to the Data
Items area.
If required, use the dialog to adjust other field options. When complete,
click Apply and close the dialog.
Adjust the Pivot Grid's Layout
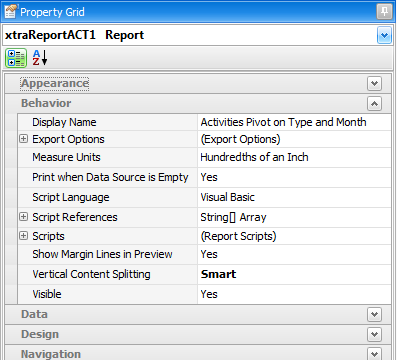
To split the grid's columns precisely by their borders in the Print Preview,
you can set the Vertical Content Splittng property of your report to Smart.
You are now ready to get the results. Please click on the "Run Report" icon on the top ribbon.


 Note
Note


 Email This Article
 Previous Article
 Next Article